What is recidivism?
Suppose a legislator or fellow advocate says the following:
“Our data show violent offenders recidivate 60 percent of the time, so we should increase sentence lengths.”
“Parole clearly doesn’t work because the recidivism rate of parolees is indistinguishable from non-parolees.”
“Well, I think it’s crazy we ever let violent criminals back on the street if they’re just going to be back behind bars in six months.”
Each of these claims refers to the concept of recidivism, the term that describes the tendency for individuals to encounter the criminal justice system after concluding prior terms of prison or probation. A recidivism “event” is one such encounter, and the recidivism rate is a quantified measured of this tendency.
Policymakers and advocates often use recidivism data to assess the effectiveness of correctional practices. Advocates for broadening the availability of college courses in prison, for instance, cite strong evidence that education reduces recidivism rates. Elsewhere, recidivism rates have been used to argue against progressive reforms and the rollback of “tough-on-crime” policies.
Indeed, recidivism rates are cited to support policy causes as wide-ranging as broadened inmate visiting rights, reduced use of private prisons, and sentencing reform.
But there’s nuance to how people (ought to) measure and talk about this important idea. This is because while recidivism can describe a relapse into new criminal behavior, not all recidivism events should be considered synonymous with backslide into criminality.
While recidivism can describe a relapse into new criminal behavior, not all recidivism events should be considered synonymous with backslide into criminality.
Without proper context, recidivism data can lead to faulty conclusions about the nature of crime and the people who commit them.
How do we get closer to the nuanced truth? By asking some questions.
How should we interpret recidivism data (and why does it matter)?
According to the Bureau of Justice Statistics (BJS), there is no universal definition for recidivism. Instead, recidivism includes three parameters shared across all definitions. These are:
- A starting event, such as a release from prison or placement on probation;
- A measure of failure, which could be all or any one of new arrests, reconvictions, and new prison terms, among others; and
- A window of measurement, or range of time (generally up to 3 or 5 years) during which failure events are tracked and measured.
Changing any of these parameters can lead to dramatic shifts in the “recidivism rate.” Still, we often use the term to refer to any broad or narrow slice of what it could potentially describe.
This is the core issue with recidivism: because it bundles behaviors and phenomena that are fundamentally dissimilar, legislators and communities may end up making decisions based on a misunderstanding of what the data actually say.
For example, when counting recidivism events, not all sources for recidivism data distinguish between missed parole appointments and convictions for new crimes (more on this later). Yet when phrases like “high recidivism” show up in online articles or evening news, the fact that recidivism can refer to new crimes make it easy to assume the worst, most headline-grabbing case.
Some states have acknowledged these limitations. For instance, in its recent prison outcomes reports, California has begun to use the rate at which individuals return to prison, rather than the rate of re-arrest, as the primary measure of recidivism. One impact of this change is that recidivism now better tracks new felony convictions, whereas the previous recidivism definition included all of felony arrests, misdemeanor arrests, and technical parole violations.
This is why it’s important to be skeptical of recidivism when it arises during policy conversations, especially when the argument being made depends on the assumption that recidivism invariably means new crimes and new victims.
To get to the truth, we ought to ask (at very least) the following three questions about any recidivism data we come across before making any conclusions:
- Who are the people described by these recidivism numbers?
- What was the measure of failure, and are radically different types of recidivism event lumped together?
- What was the window of measurement?
Let’s talk about each individually.
Who are the people being (allegedly) described by recidivism data?
Not every person who enters (and exits) prison is the same, and few statements can fairly describe all people who encounter the criminal justice system. Even labels as broad as “felon” or “criminal” ought to raise skepticism when one considers the disgraceful number of wrongful convictions in America.
Cohorts of incarcerated person differ by age at incarceration or release, sex, nature of offense, and number of prior arrests, among other factors. Each of these factors can have a substantial impact on recidivism rates. For instance, while a BJS data source reported that overall rearrest rate at three years was 67.5%, stratifying by number of prior arrests shows (at least) two distinct populations (see Figure 1).
Figure 1. Three-year rearrest rates for released individuals based on number of prior arrests
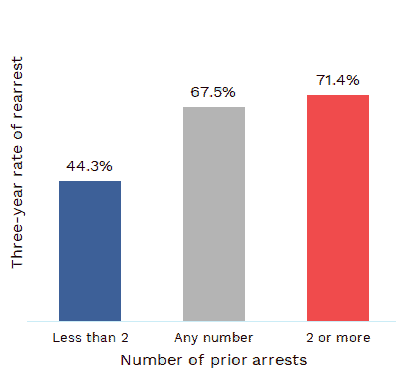
Caption. Data were sourced from the BJS Prisoner Recidivism Analysis Tool of 1994. The tool calculates recidivism data for a cohort of individuals across fifteen states, all of whom were released in 1994 and followed for a period of three years.
These differences matter because many criminal justice and corrections policies have disproportionate impact on different groups, even when statutes are written in broad strokes with no explicit discriminatory element (there is perhaps no better example of this phenomenon than the 100-to-1 crack vs. powder cocaine sentencing disparity).
While some differences in recidivism rate might seem fairly intuitive (women recidivate less often than men, individuals with more prior felonies are more likely to recidivate than those with fewer previous encounters), not all trends are as easy to predict.
Felonies fall into one of a few broad categories: public order, drug, property, and violent. Depending on the category, recidivism can vary in noteworthy ways. Consider the following 5-year re-arrest rates from BJS, stratified by the committing offense and the type of new felony:
Table 1. Difference in five-year re-arrest rates for specific cohorts of released individuals to all released individuals, stratified by new (committing) offense type
[table “7” not found /]Caption. Data were sourced from the 2014 BJS report titled Recidivism of Prisoners Released in 30 States in 2005: Patterns from 2005 to 2010.
Regardless of the type of prior felony, released prisoners are most commonly rearrested for public order offenses. And while individuals with prior violent felonies are more likely to be rearrested for new violent felonies, the difference is smaller than many might assume.
So what’s the lesson? When someone talks about the recidivism rate for “violent offenders,” one should never blindly assume that this is synonymous with the rate at which these individuals commit new violent crimes.
Don’t assume the recidivism rate of “violent offenders” is synonymous with the rate at which these individuals commit new violent crimes.
Finally, one should be wary of how recidivism data deals with individuals on probation, parole, or other types of mandated supervision. When under a supervisory term like parole, individuals must follow certain rules that–if violated–can lead to arrest, jail terms, or a return to prison. These rules might include prohibitions on drinking alcohol, nightly curfews, or the need to meet regularly with a parole officer.
Recidivism data tends to lump technical violations like breaking curfew or drinking alcohol with new felony convictions. For instance, the National Institute for Justice writes that for their own purposes, recidivism
refers to a person’s relapse into criminal behavior [as] measured by criminal acts that resulted in rearrest, reconviction or return to prison with or without a new sentence during a three-year period following the prisoner’s release. (emphasis added)
No explicit distinctions are made between rearrests for parole violations and new convictions. But should technical violations be categorized as a “relapse into criminal behavior” to the same degree other sorts of recidivism event ought to be? (For more on the topic, check out this article from FiveThirtyEight).
To their credit, some sources and studies do make a concerted effort to separate different types of recidivism event. Doing so is vital to ensuring that policies are not written or propped up based on an inflated conception of the tendency for criminal relapse.
In many important conversations, however, the term “recidivism” continues to be used indiscriminately, leaving it up to the advocate to do their own digging.
What counts as a recidivism event?
The issues raised by technical violations in recidivism calculations touch on the broader issue of how different data sources address (or fail to address) the different types of recidivism event.
Recidivism is often measured by counting the number of released persons (or persons on parole) to have been either rearrested, reconvicted, or reincarcerated at some point within a given post-release window. But not all arrests are rightful nor conclude with new convictions, nor do all convictions result in new jail or prison terms. But depending on the source used, one might not know how a recidivism rate of 30 or 40 percent breaks into these categories. Consider in Figure 2 how different the recidivism rate is for different types of recidivism event.
Figure 2. Difference in three-year recidivism rates by type of recidivism event
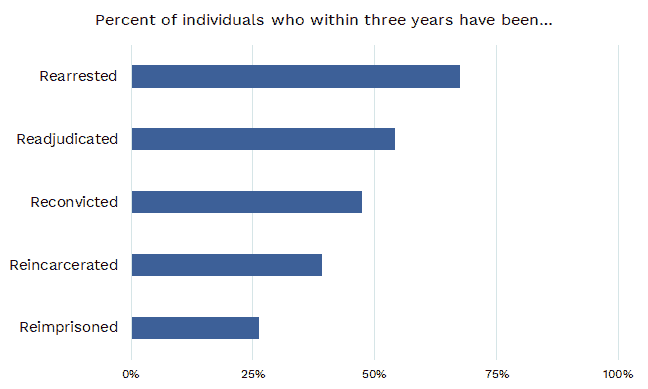
Caption. Data were sourced from the BJS Prisoner Recidivism Analysis Tool of 1994. The tool calculates recidivism data for a cohort of individuals across fifteen states, all of whom were released in 1994 and followed for a period of three years. Readjudication describes returns to court. Reincarceration refers to returns to prison or jail, while reimprisonment only describes returns to prison.
The interrogation of recidivism data shouldn’t end with distinguishing arrests from convictions, or convictions from new prison terms. If a study isolates the rate of new convictions, does it go further to distinguish between misdemeanor and felony convictions, or more serious crimes from less serious ones? These are important considerations even if more granular data aren’t available.
Even reincarceration contains gradations of nuance. Reincarceration–as opposed to reimprisonment–may include both jail and prison terms of any length. Therefore, because parole violations and misdemeanors both might be punished with short jail terms instead of prison, even reincarceration cannot be assumed to be synonymous with new felonies.
These distinctions matter because most criminal justice policies will have different impacts on different cohorts. Many reform efforts, for instance, exclude individuals convicted of violent crimes, or permit (and sometimes encourage) harsher treatment of these individuals.
What is the timeline for release?
Finally, the timeline for release is important, especially when comparing recidivism across studies or sources. There isn’t anything special about specific year or time cut-offs, but more about being diligent about your comparisons.
Want to learn more?
One of the best places to study recidivism across the U.S. is BJS, which collects and reports both state and federal recidivism data. Their 1994 Prisoner Recidivism Analysis Tool does a great job of clearly showcasing how differences in measurement matter and is worth exploring. Their 2005 version is also useful, but only reports the rate of re-arrest, and doesn’t include numbers on new convictions or reincarceration. It also differs from the 1994 tool in terms of methodology, meaning data for the two aren’t directly comparable. For topics not covered in the analysis tools, their 2014 report on recidivism trends does a fantastic job of uncovering much of the nuance that can get obscured in more general reporting.
The Urban Institute has its own very useful guide on understanding recidivism at the local level. It includes a neat breakdown of the pros and cons of three common individual measures of recidivism: re-arrest, rebooking, and reconviction. The guide also touches on ways to better measure and understand recidivism.
And just last month, authors Jeremy Butts and Vincent Schiraldi of the Harvard Kennedy School of Government published a new study outlining why recidivism is a flawed metric for assessing justice and criminal policies. Writing on the Marshall Project, Butts and Schiraldi conclude that while “pertinent, [recidivism] is inadequate and often misleading.”
Linked Sources
(2011, November). The effects of prison visitation on offender recidivism. St. Paul, MN: Minnesota Department of Corrections. Retrieved from https://mn.gov.
(2016, June). How private prison companies increase recidivism. Washington, DC: In the Public Interest. Retrieved from https://www.inthepublicinterest.org.
Butts, Jeffery & Schiraldi, Vincent. (2018, March). Recidivism reconsidered: preserving the community justice mission of community corrections. Boston, MA: Harvard Kennedy School. Retrieved from https://www.hks.harvard.edu.
Davis, Lois M. et al. (2014). How Effective Is Correctional Education, and Where Do We Go from Here? The Results of a Comprehensive Evaluation. Santa Monica, CA: RAND Corporation. Retrieved from: https://www.rand.org.
Durose, Matthew R. et al. (2014, April). Recidivism of prisoners released in 30 states in 2005: patterns from 2005 to 2010. Washington, DC: Bureau of Justice Statistics. Retrieved from https://www.bjs.gov.
Glazer, Jessica. (2014, November 13). Why it might be time to rethink the rules of parole. FiveThirtyEight. Retrieved from https://fivethirtyeight.com.
Kennedy, Sean. (2016, August 22). “Smart on crime” doesn’t lower crime rates or recidivism. RealClear Policy. Retrieved from https://www.realclearpolicy.com.
Kernan, Scott et al. (2017, October 10). 2017 Outcome Evaluations Report: an examination of offenders released in fiscal year 2012-2013. Sacramento, CA: California Department of Corrections and Rehabilitation. Retrieved from https://www.cdcr.ca.gov/.
Vagins, Deborah et al. (2006, October). Cracks in the System: Twenty Years of the Unjust Federal Crack Cocaine Law. Washington, DC: American Civil Liberties Union. Retrieved from https://www.aclu.org.
Measuring recidivism at the local level: a quick guide. Washington, DC: Urban Institute. Retrieved from https://www.urban.org.